cell2home - create reference and compute homing scores
[1]:
import sys
import scanpy as sc
import pandas as pd
import numpy as np
import matplotlib.pyplot as plt
import matplotlib
import seaborn as sns
from matplotlib import rcParams

import scipy.sparse
import mudata
import muon as mu
import session_info

import cell2home as c2h

%config InlineBackend.figure_format = 'retina'

sc.set_figure_params(dpi=80)
rcParams["axes.grid"] = False
/home/jovyan/my-conda-envs/cell2home/lib/python3.8/site-packages/tqdm/auto.py:21: TqdmWarning: IProgress not found. Please update jupyter and ipywidgets. See https://ipywidgets.readthedocs.io/en/stable/user_install.html
  from .autonotebook import tqdm as notebook_tqdm
The demo notebook makes use of two publicly available objects, download these into the same directory as the notebook before proceeding:
https://cellgeni.cog.sanger.ac.uk/pan-immune/CountAdded_PIP_T_object_for_cellxgene.h5ad
https://cellgeni.cog.sanger.ac.uk/pan-immune/myeloid.h5ad
[2]:
# Create a list to hold the pairs
pairs = []
# Iterate through the dictionary to create pairs
for key, values in c2h.markers.items():
    for value in values:
        pairs.append((key, value))

# Create a DataFrame from the pairs
interactions = pd.DataFrame(pairs, columns=['target', 'source'])
interactions
[2]:
| target | source | |
|---|---|---|
| 0 | CCR1 | CCL3 |
| 1 | CCR1 | CCL5 |
| 2 | CCR1 | CCL7 |
| 3 | CCR1 | CCL8 |
| 4 | CCR1 | CCL14 |
| ... | ... | ... |
| 89 | ITGB7 | FN1 |
| 90 | ITGB7 | MADCAM1 |
| 91 | ITGB7 | VCAM1 |
| 92 | ITGB7 | CDH1 |
| 93 | ITGAE | CDH1 |
94 rows × 2 columns
[3]:
# Load reference data (these are the cells expressing ligands that attract the migrating cells)
# here T cells from cross-tissue immune atlas (Dominguez-Conde et al. Science 2022)
adata = sc.read_h5ad('CountAdded_PIP_T_object_for_cellxgene.h5ad')
adata.X = adata.layers["counts"]
del adata.layers["counts"]
[4]:
adata
[4]:
AnnData object with n_obs × n_vars = 216611 × 36601
    obs: 'Organ', 'Donor', 'Chemistry', 'Predicted_labels_CellTypist', 'Majority_voting_CellTypist', 'Manually_curated_celltype', 'Sex', 'Age_range'
    uns: 'Age_range_colors', 'Sex_colors'
    obsm: 'X_umap'
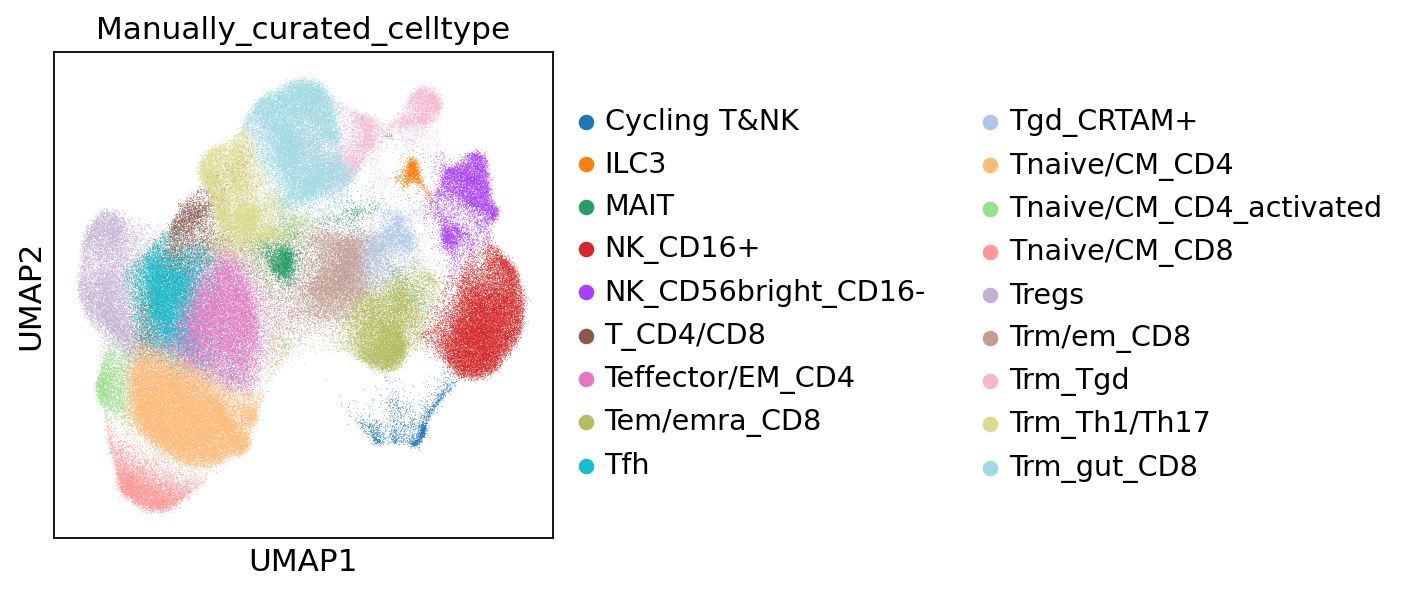
[5]:
sc.pl.umap(adata, color='Manually_curated_celltype')
/home/jovyan/my-conda-envs/cell2home/lib/python3.8/site-packages/scanpy/plotting/_tools/scatterplots.py:394: UserWarning: No data for colormapping provided via 'c'. Parameters 'cmap' will be ignored
  cax = scatter(
[6]:
# Construct signatures from selected cell types
signatures = c2h.construct_signatures(adata, 'Manually_curated_celltype', interactions)
signatures
[6]:
| population | source | expression | target | |
|---|---|---|---|---|
| 0 | Cycling T&NK | CCL3 | 0.881343 | CCR1 |
| 1 | Cycling T&NK | CCL3 | 0.881343 | CCR3 |
| 2 | Cycling T&NK | CCL3 | 0.881343 | CCR5 |
| 3 | ILC3 | CCL3 | -0.758298 | CCR1 |
| 4 | ILC3 | CCL3 | -0.758298 | CCR3 |
| ... | ... | ... | ... | ... |
| 1687 | Trm_Tgd | CDH1 | 2.585478 | ITGAE |
| 1688 | Trm_Th1/Th17 | CDH1 | 0.798664 | ITGB7 |
| 1689 | Trm_Th1/Th17 | CDH1 | 0.798664 | ITGAE |
| 1690 | Trm_gut_CD8 | CDH1 | 0.491016 | ITGB7 |
| 1691 | Trm_gut_CD8 | CDH1 | 0.491016 | ITGAE |
1692 rows × 4 columns
[7]:
# Load query data (these are the migrating cells expressing chemokine receptors)
# here cross-tissue immune atlas (Dominguez-Conde et al. Science 2022)
adata = sc.read_h5ad('/lustre/scratch126/cellgen/teichmann/od5/datasets/myeloid.h5ad')
[8]:
# Compute migration scores for each cell in query data against the generated reference
mdata = c2h.compute_cell_scores(adata, signatures)
/home/jovyan/my-conda-envs/cell2home/lib/python3.8/site-packages/anndata/_core/anndata.py:1840: UserWarning: Variable names are not unique. To make them unique, call `.var_names_make_unique`.
  utils.warn_names_duplicates("var")
/home/jovyan/my-conda-envs/cell2home/lib/python3.8/site-packages/anndata/_core/anndata.py:1840: UserWarning: Variable names are not unique. To make them unique, call `.var_names_make_unique`.
  utils.warn_names_duplicates("var")
[9]:
# Collapse scores at the level of population and target=receptor
# (this is done for later analysis aggregating signals at the receptor level)
c2h.collapse_scores(mdata, ["population", "target"], collapse_key="cell2home_target_affinity")
[10]:
# Collapse scores at the level of population (this is the final result)
c2h.collapse_scores(mdata, "population",
                    score_key="cell2home_target_affinity",
                    collapse_key="cell2home_affinity"
                   )
[11]:
mdata.update()
mdata
[11]:
MuData object with n_obs × n_vars = 51552 × 38779
  4 modalities
    rna:    51552 x 36601
      obs:  'Organ', 'Donor', 'Chemistry', 'Predicted_labels_CellTypist', 'Majority_voting_CellTypist', 'Manually_curated_celltype'
      obsm: 'X_umap'
    cell_scores:    51552 x 1692
      obs:  'Organ', 'Donor', 'Chemistry', 'Predicted_labels_CellTypist', 'Majority_voting_CellTypist', 'Manually_curated_celltype'
      var:  'population', 'source', 'target'
      obsm: 'X_umap'
    cell2home_target_affinity:      51552 x 468
      obs:  'Organ', 'Donor', 'Chemistry', 'Predicted_labels_CellTypist', 'Majority_voting_CellTypist', 'Manually_curated_celltype'
      var:  'population', 'target'
    cell2home_affinity:     51552 x 18
      obs:  'Organ', 'Donor', 'Chemistry', 'Predicted_labels_CellTypist', 'Majority_voting_CellTypist', 'Manually_curated_celltype'
      var:  'population'
[12]:
# List populations for plotting
populations = mdata['cell2home_affinity'].var_names.unique().tolist()
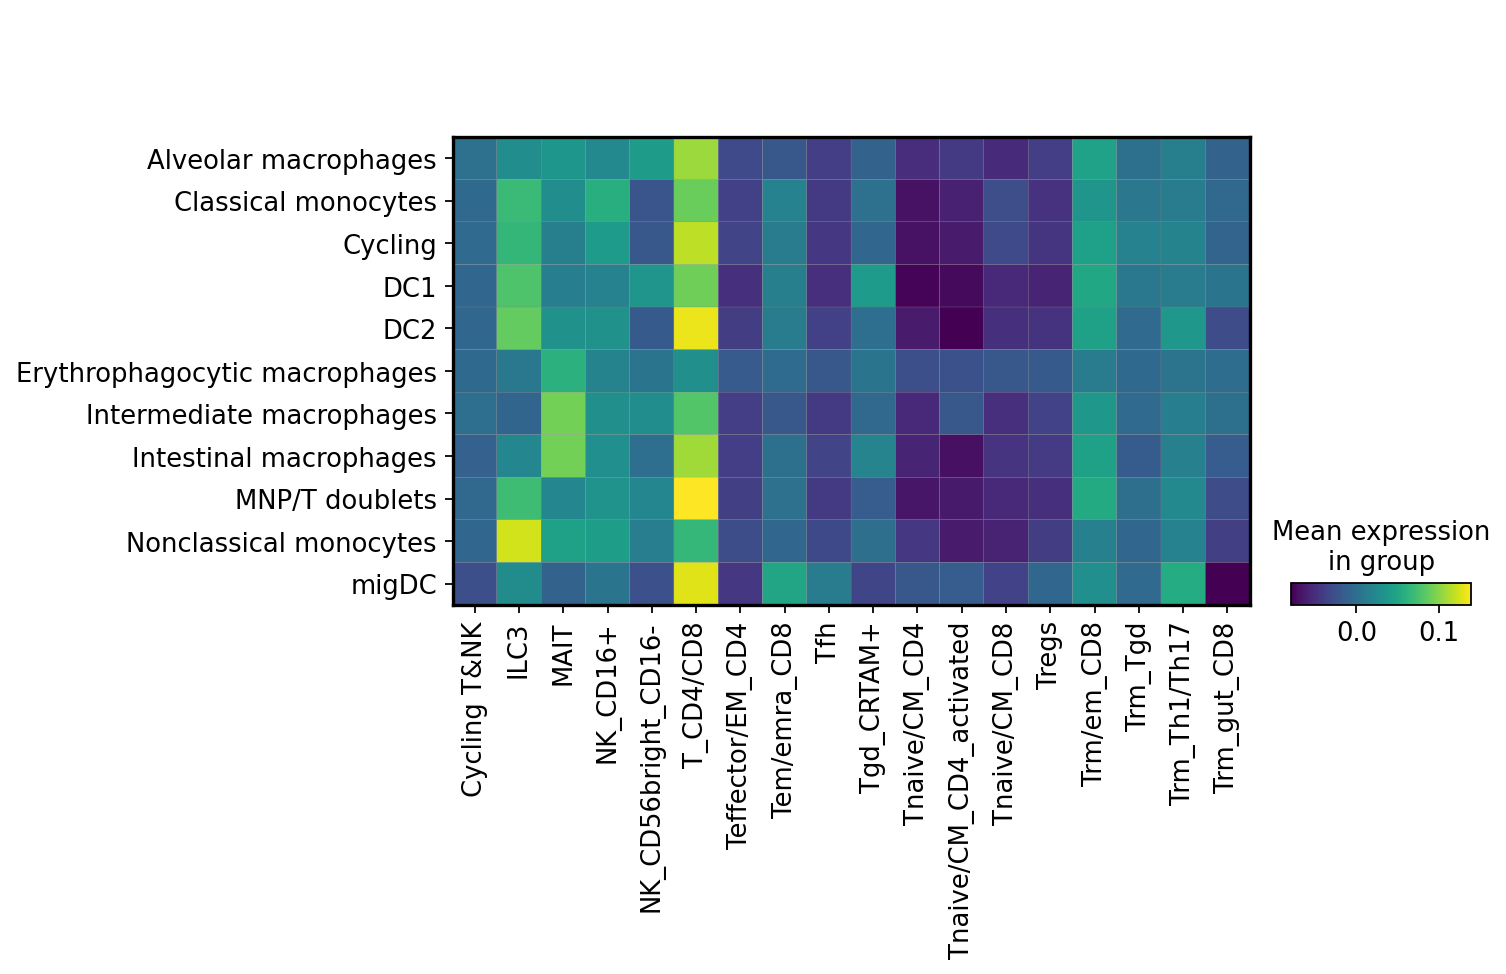
[13]:
# Visualise scores as heatmap
sc.pl.matrixplot(mdata['cell2home_affinity'],
                 var_names=populations,
                 groupby='Manually_curated_celltype'
                )
[14]:
# Scaling often works better
sc.pl.matrixplot(mdata['cell2home_affinity'],
                 var_names=populations,
                 groupby='Manually_curated_celltype',
                 standard_scale='var'
                )
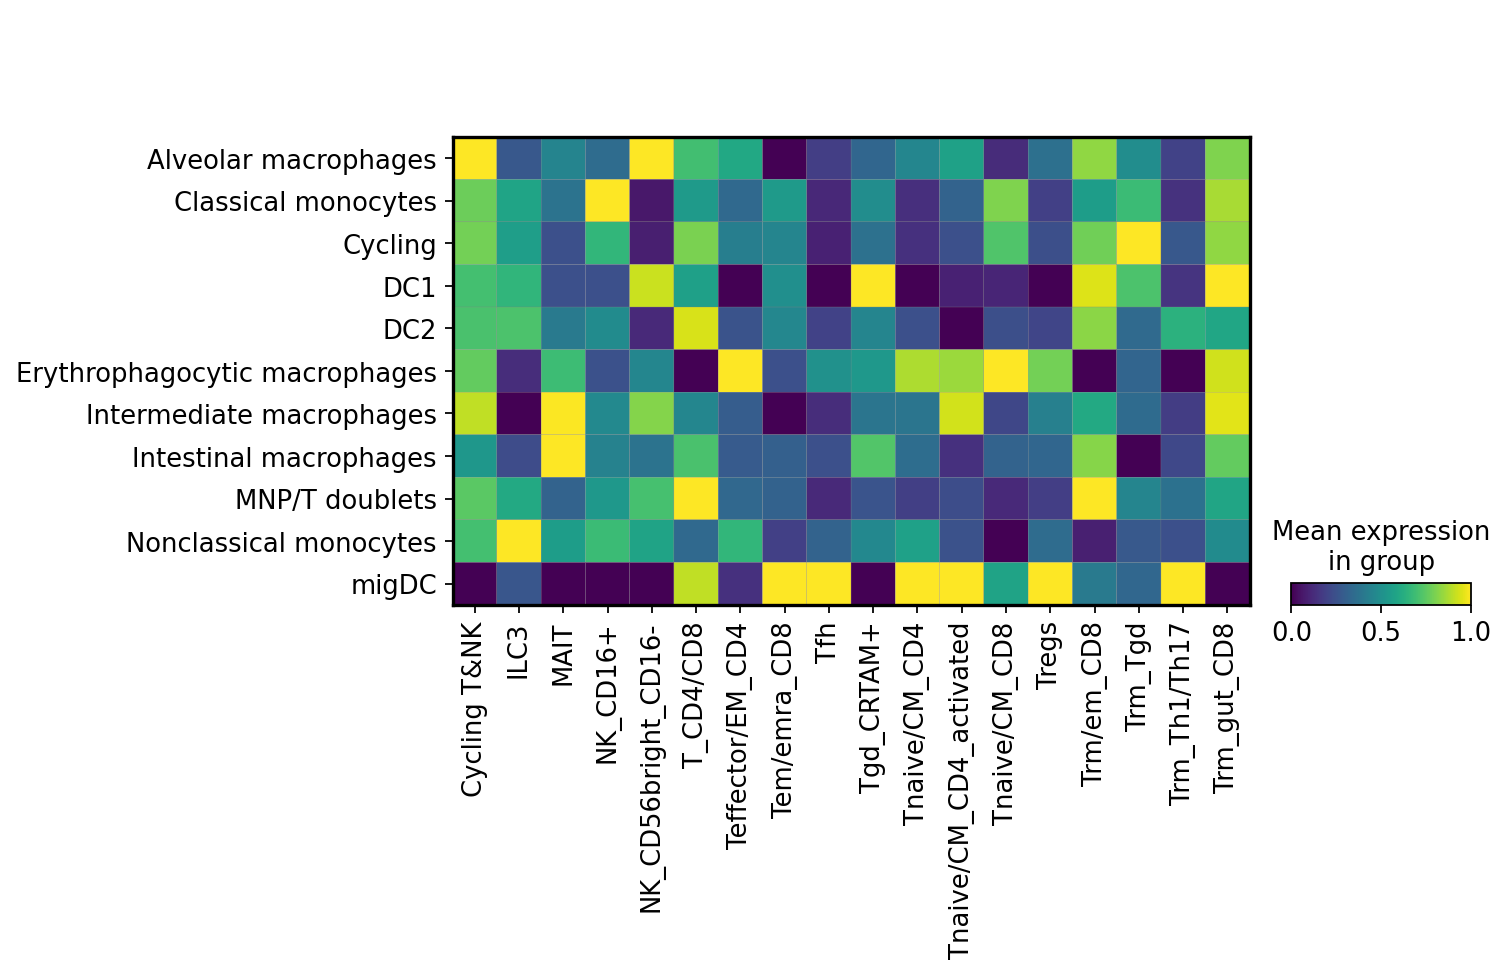
Here colour intensity shows predicted affinity of myeloid cells on the y axis towards various T and NK cell subsets on x axis.
[15]:
# Plot affinity of the myeloid cells towards NK_CD56bright_CD16-, and specific affinity through XCR1
mu.pl.embedding(mdata,
                basis="rna:X_umap",
                color=["cell2home_affinity:NK_CD56bright_CD16-", "cell2home_target_affinity:NK_CD56bright_CD16-:XCR1", "rna:Manually_curated_celltype"],
                cmap='inferno',
                vmax='p99'
               )
/home/jovyan/my-conda-envs/cell2home/lib/python3.8/site-packages/scanpy/plotting/_tools/scatterplots.py:394: UserWarning: No data for colormapping provided via 'c'. Parameters 'cmap' will be ignored
  cax = scatter(
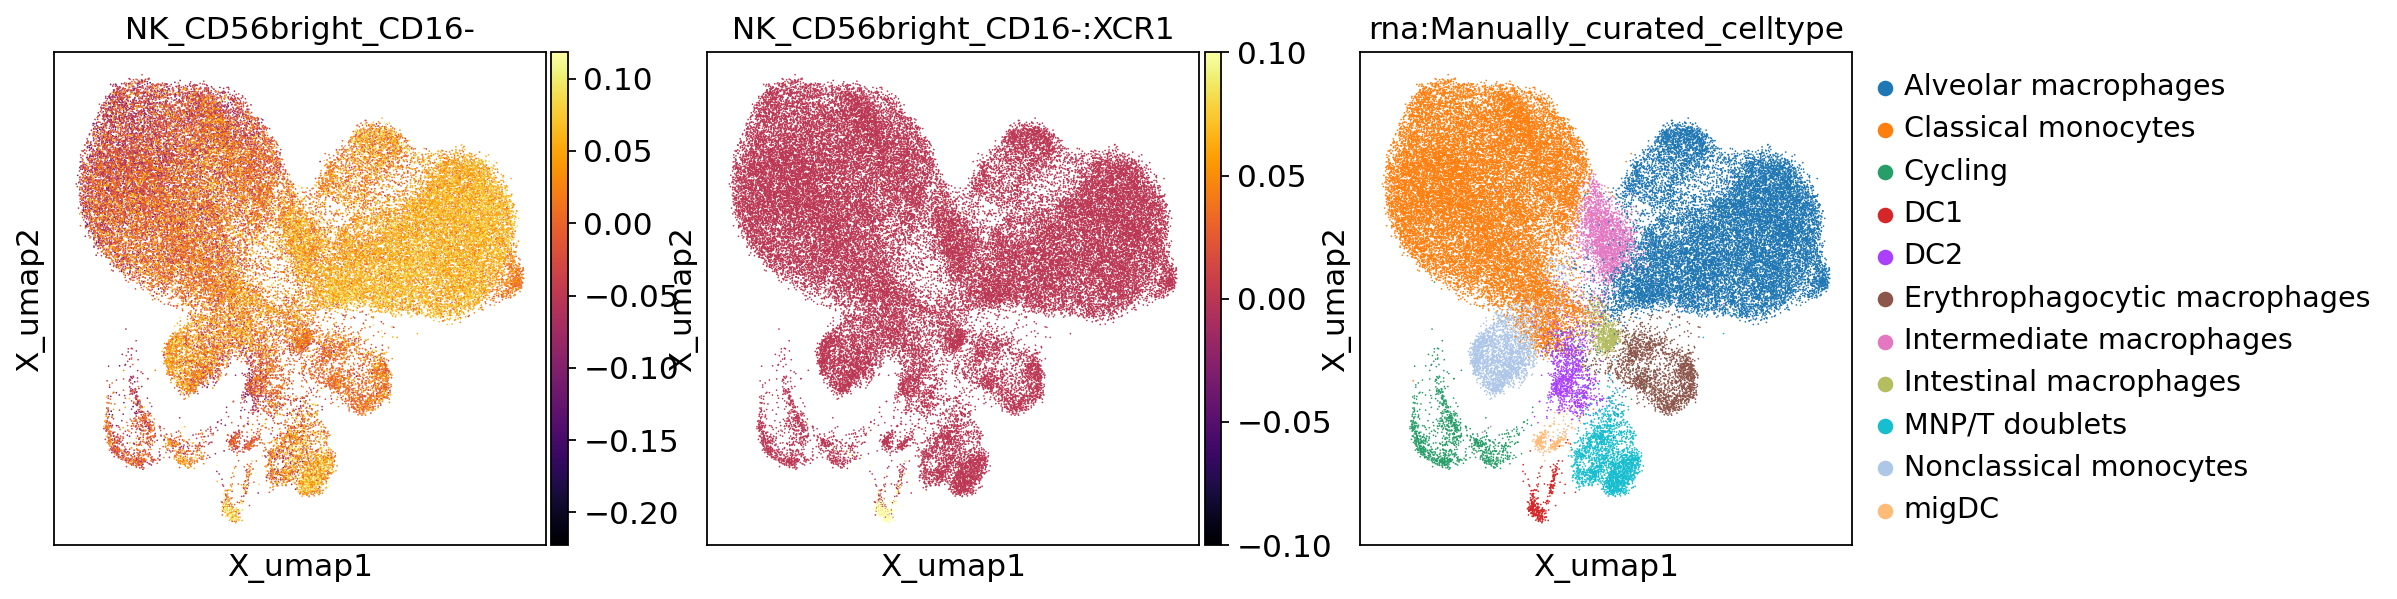
We find that NK_CD56bright_CD16- are predicted to attract Alveolar macrophages and DC1, and that affinity towards DC1 is mediated by XCR1
[16]:
# Extract matrix for plotting clustered heatmap

A = mdata["cell2home_affinity"]                       # your AnnData
g = A.obs["Manually_curated_celltype"]

# group means (rows = groups, cols = populations in your order)
M = sc.get.obs_df(A, keys=list(populations)).assign(_g=g.values).groupby("_g").mean()[list(populations)]
if pd.api.types.is_categorical_dtype(g):      # keep the displayed row order
    M = M.reindex(g.cat.categories)

# standard_scale='var' → min–max per column
M_plot = ((M - M.min()) / (M.max() - M.min())).fillna(0.0)
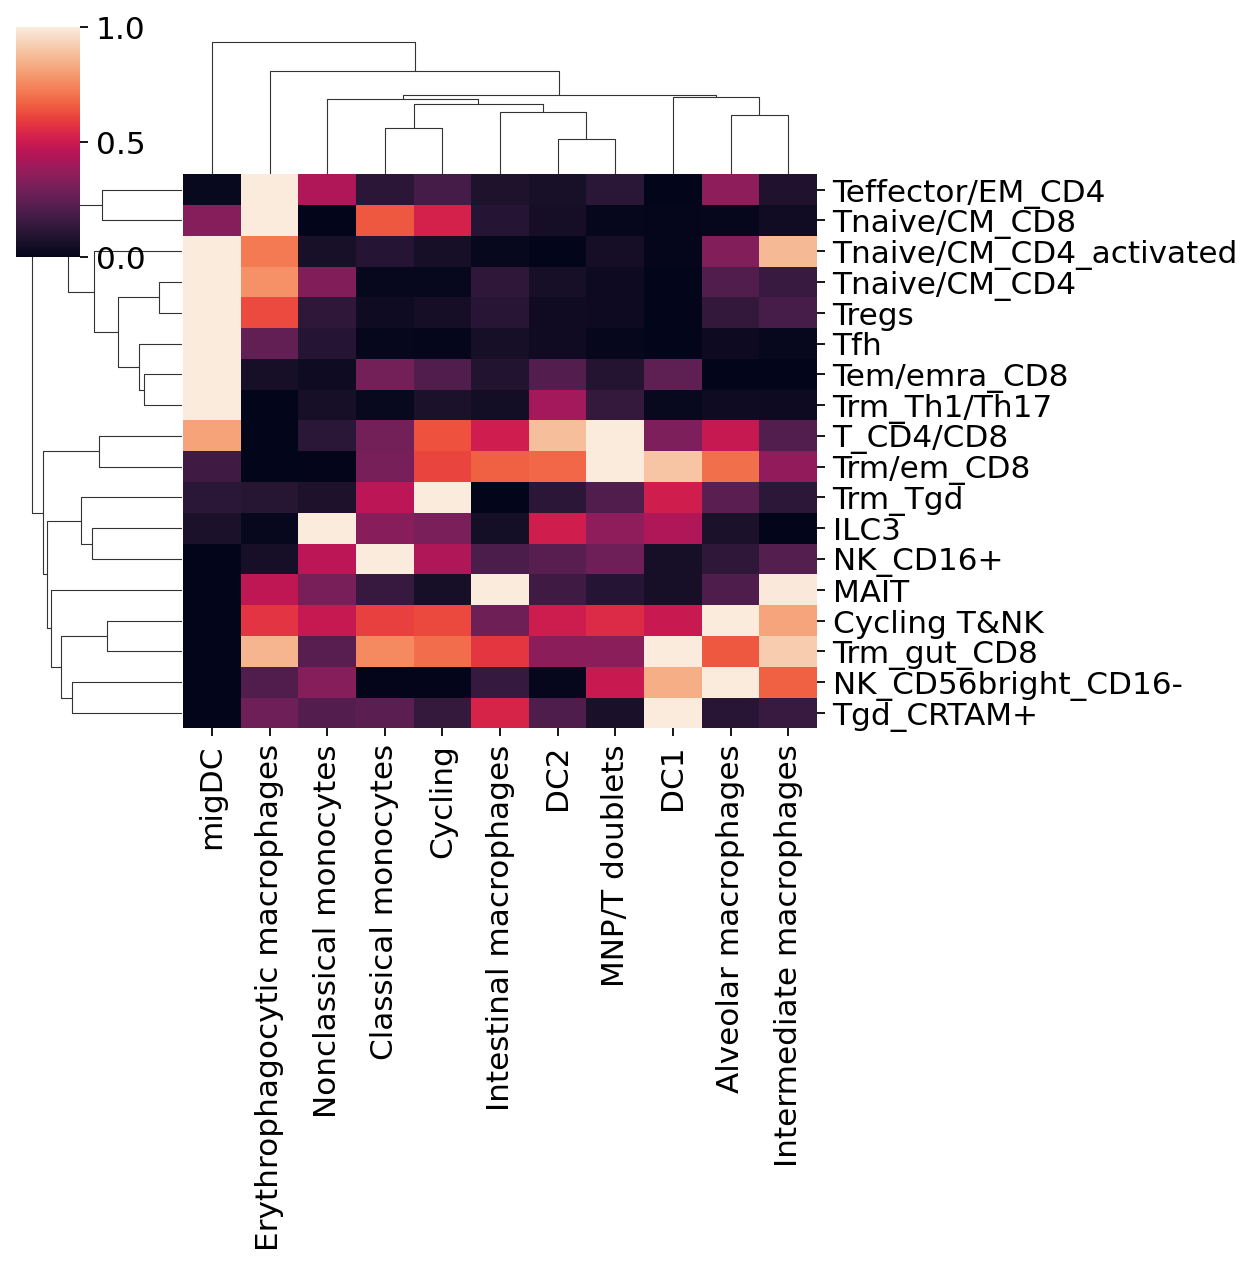
[17]:
# Prioritise strong signals for visualisation
M_plot_stronger = M_plot.pow(2.0)          # try 2–3; higher => harsher
[18]:
sns.clustermap(M_plot_stronger.T, col_cluster=True, row_cluster=True, figsize = (8,8))
[18]:
<seaborn.matrix.ClusterGrid at 0x7fa699f08a90>
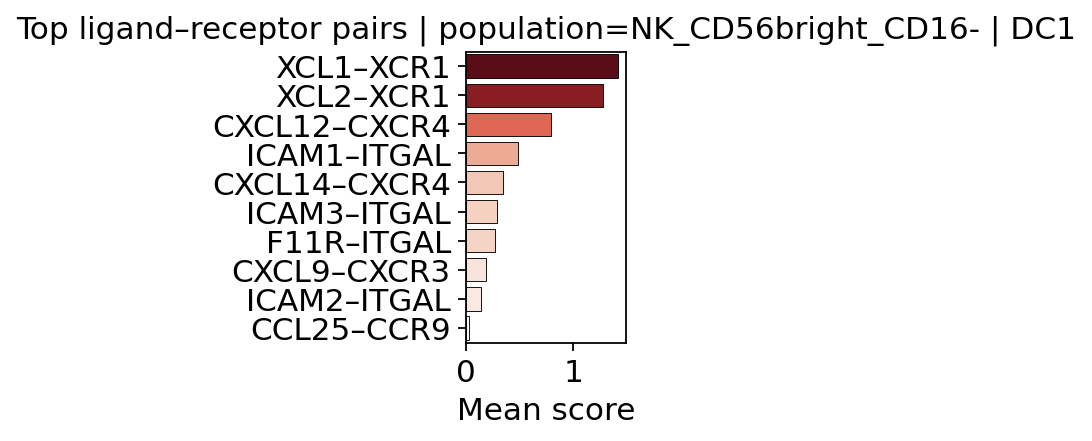
[19]:
# Find top interactions predicted to drive migration of a cell type to a target tissue/cell

top = c2h.compute_top_interactions_one_group(
    mdata,
    modality="cell_scores",
    identity="NK_CD56bright_CD16-",
    var_key="population",
    split_obs_key="Manually_curated_celltype",
    group_identity="DC1",
    top_n=10,
)
top
[19]:
XCL1–XCR1       1.420306
XCL2–XCR1       1.277904
CXCL12–CXCR4    0.788314
ICAM1–ITGAL     0.479316
CXCL14–CXCR4    0.339726
ICAM3–ITGAL     0.285965
F11R–ITGAL      0.271622
CXCL9–CXCR3     0.181886
ICAM2–ITGAL     0.134578
CCL25–CCR9      0.023951
dtype: float32
[20]:
c2h.plot_top_interactions_bar_one_group(
    top,
    title="Top ligand–receptor pairs | population=NK_CD56bright_CD16- | DC1",
    cmap="Reds",
    figsize=(3,3)
)
[21]:
# Save chemokine2cell object
mdata.write("cell2home_demo.h5mu")
[22]:
session_info.show()
[22]:
Click to view session information
-----
anndata             0.9.2
cell2home           0.0.1
matplotlib          3.7.5
mudata              0.2.3
muon                0.1.6
numpy               1.24.4
pandas              2.0.3
scanpy              1.9.6
scipy               1.10.1
seaborn             0.11.2
session_info        v1.0.1
-----
Click to view modules imported as dependencies
PIL                 10.4.0
asttokens           NA
backcall            0.2.0
backports           NA
cycler              0.12.1
cython_runtime      NA
dateutil            2.9.0
debugpy             1.8.5
decorator           5.1.1
executing           2.1.0
get_annotations     NA
h5py                3.11.0
importlib_metadata  NA
importlib_resources NA
ipykernel           6.14.0
jaraco              NA
jedi                0.19.1
joblib              1.4.2
kiwisolver          1.4.7
llvmlite            0.41.1
matplotlib_inline   0.1.7
more_itertools      10.3.0
mpl_toolkits        NA
natsort             8.4.0
numba               0.58.1
packaging           26.0
parso               0.8.4
patsy               1.0.2
pexpect             4.9.0
pickleshare         0.7.5
platformdirs        4.3.6
prompt_toolkit      3.0.48
psutil              6.0.0
ptyprocess          0.7.0
pure_eval           0.2.3
pydev_ipython       NA
pydevconsole        NA
pydevd              2.9.5
pydevd_file_utils   NA
pydevd_plugins      NA
pydevd_tracing      NA
pygments            2.18.0
pynndescent         0.6.0
pyparsing           3.1.4
pytz                2026.1.post1
setuptools          75.3.0
six                 1.16.0
sklearn             1.3.2
stack_data          0.6.2
statsmodels         0.14.1
threadpoolctl       3.5.0
tornado             6.4.1
tqdm                4.67.3
traitlets           5.14.3
umap                0.5.7
wcwidth             0.2.13
zipp                NA
zmq                 26.2.0
-----
IPython             8.4.0
jupyter_client      8.6.3
jupyter_core        5.8.1
-----
Python 3.8.20 | packaged by conda-forge | (default, Sep 30 2024, 17:52:49) [GCC 13.3.0]
Linux-4.15.0-213-generic-x86_64-with-glibc2.17
-----
Session information updated at 2026-03-09 17:36
[ ]: